rustingcrab
![]()
Performance Analysis with Flamegraph
Profiling is the process of measuring a program’s behavior during execution to understand how it uses resources such as CPU time and memory. The main goal is to discover which parts of the code consume the most time or resources, helping identify where performance improvements can be made.
A flamegraph is a visual representation of data collected during profiling. It shows the function call stack over time. Each function is represented by a horizontal bar, and the bar’s width indicates how much time was spent in that function. Functions with wider bars consume more time.
The bars are arranged in layers. The top function is the one currently being executed, and below it are the functions that called it. Reading is done top-down, following the call sequence.
To interpret a flamegraph, look for the widest bars at the top. They indicate the functions that contribute most to total execution time. If a function appears in multiple parts of the graph or has a large width, it is a good candidate for optimization. It’s also useful to observe functions that, although small individually, appear many times, since their cumulative cost may be high.
In short, profiling is used to analyze a program’s performance, and the flamegraph is a visual tool that helps quickly identify where time is being spent, allowing focus on the parts of the code that need the most attention.
Benchmarks in Rust
cargo bench is the Cargo command to compile and run benchmark targets in your project, using the “bench” profile (optimizations enabled and debug symbols, if configured). In practice, it looks for files in benches/, compiles each one as a benchmark binary, and runs them. Since Rust’s official benchmark harness remains unstable, the most common workflow is to use a benchmarking library (e.g., Criterion) as a development dependency; it provides warm-up, statistical sampling, outlier detection, and reporting, allowing comparison of function versions under controlled conditions.
Benchmarking answers “how long it takes” in reproducible scenarios; profiling answers “where time is spent” during execution. That’s where pprof comes in. The pprof crate is an in-process profiler: it periodically samples call stacks while your code runs and, from these samples, generates a flamegraph. A flamegraph is a visualization where each rectangle represents a function, width is proportional to the number of samples attributed to that function (time), and height represents stack depth. By combining cargo bench to produce a representative execution and pprof to sample it, you both measure and visualize the same workload: the benchmark tells you whether it got faster or slower; the flamegraph tells you why, pointing out hotspots.
There are two ways to plug this into the workflow. You can profile “externally” using system tools (like perf or cargo flamegraph) on the binary executed by cargo bench; in this case, the profiler doesn’t appear in Cargo.toml and acts externally. Or you can profile “internally” by starting pprof inside the benchmark itself; in this case, the profiler becomes a development dependency and the benchmark itself writes the flamegraph.svg file. In both cases, reading is the same: find the target function in the graph, follow the path of wider boxes above it, and you’ll see the call chain where the CPU is actually being spent.
cargo bench also generates a very interesting report of your code (target/criterion/report/index.html) with the distribution of times and several other statistics:
The Example
We created deliberately slow code, with an implicit problem, to try to identify with the flamegraph. The “slow” code we wrote was a word-count function purposely implemented inefficiently. For each line of text, it called Regex::new to compile a regex pattern and even created a second regex to “clean” each word. This means that instead of reusing a ready regex, it recompiled the search automaton thousands of times. In addition, it made unnecessary allocations (to_string, to_lowercase, format!, clone) and, in the end, recopied the entire map to sort by key size. The result is an artificial bottleneck: the flamegraph shows almost all time spent in internal regex functions related to automaton construction (Builder::build*), instead of the counting logic itself.
In the project setup, we have this Cargo.toml:
[package]
name = "slowwords"
version = "0.1.0"
edition = "2021"

[lib]
name = "slowwords"
path = "src/lib.rs"

[dependencies]
regex = "1.10"

[dev-dependencies]
criterion = "0.7.0"
pprof = { version = "0.15", features = ["flamegraph"] }

[[bench]]
name = "bench"
harness = false

[profile.bench]
debug = true
Thus, this project brings together three things: a library (slowwords), a statistical benchmark (Criterion), and an embedded profiler (pprof) to visualize where CPU time is being spent.
The benchmark code (benches/bench.rs) exists because Cargo looks in this directory (benches/) for the benchmark targets declared in Cargo.toml. It is necessary for cargo bench to know what to run.
When we run the command cargo bench it executes this program.
In this project, it loads the library function (contar_palavras_*), builds a large artificial text as workload, and measures execution time with Criterion. In addition, inside it we initialize pprof, run the function several times under sampling, and finally write a flamegraph.svg file. In other words, bench.rs plays two roles at once: running statistical benchmarks (how long it takes) and generating a flamegraph (where time is spent).
Identifying the “Culprit”
After running benches/bench.rs with the command cargo bench, a flamegraph.svg file will be created in the project root:

It’s hard to visualize, but the widest bars near the top are the “culprits.” In our code, we have a contar_palavras_lento function and some wide bars above it. I zoomed in for you:
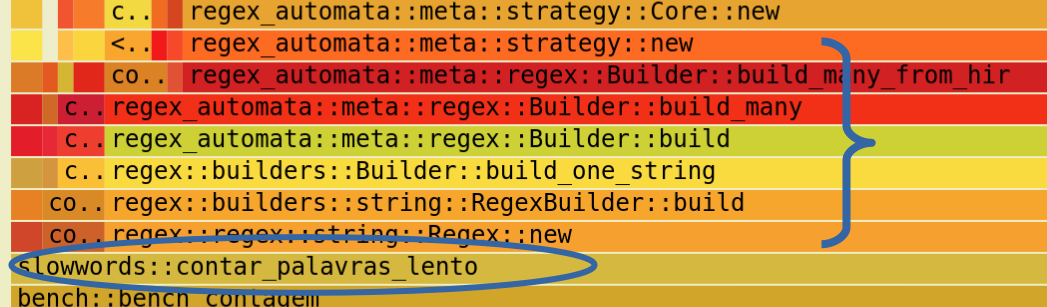
We can see that it is invoking a series of “wide” and “red” functions, all related to regex compilation, meaning this function is compiling the regex for each word!
And in the criterion report this is clear:
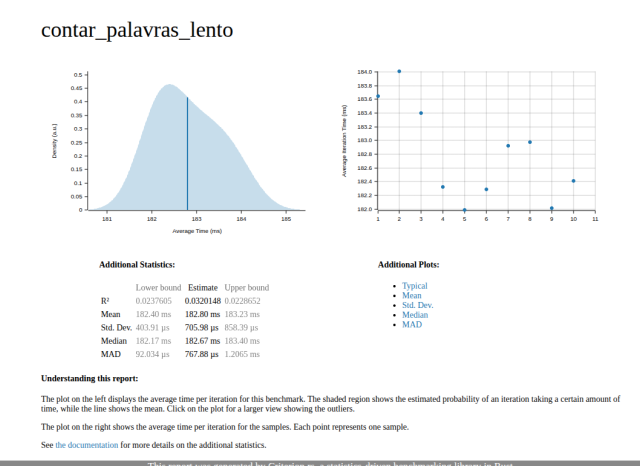
– The left graph is the estimated distribution of execution time for one iteration. It looks close to a symmetric normal curve, with no visible long tail. Therefore, there is no significant skew, although the slight deformation may signal something unexpected.
– The mean (Mean) is 182.80 ms per iteration. The value is indeed in milliseconds, confirming that each call takes hundreds of thousands of microseconds, i.e., hundreds of milliseconds — far more than acceptable for such a simple function.
– The standard deviation (~705 µs) and MAD (~767 µs) are small relative to the mean (182 ms), indicating runs are consistent and stable.
– The right figure shows individual samples per iteration; most cluster near the mean, with no extreme outliers.
Conclusion: the function is consistently slow (around 182 ms per execution) due to the deliberate regex recompilation issue, although the time distribution is not technically “skewed.” The fact that the mean is in milliseconds confirms the artificial cost of regex recompilation completely dominated execution time.
Fixing the Problem
Well, in the after version the code was changed to remove this bottleneck. I moved regex compilation out of the hot path. Instead of calling Regex::new(...) for each line and word, I created a single global lazy regex with once_cell::sync::Lazy, initialized on first use and reused in all calls and threads. This eliminates the repeated runtime parse/compile cost; the flamegraph no longer shows the Regex::new → Builder::build* chain as dominant and instead concentrates time on regex execution (find_iter), to_lowercase, and map insertions. I also reduced obvious allocations: dropped format! and key clone, and switched to entry in the BTreeMap. The main gain comes from amortizing regex compilation to “only once,” removing the structural bottleneck without changing counting logic.
After running cargo bench again, we see a new flamegraph:

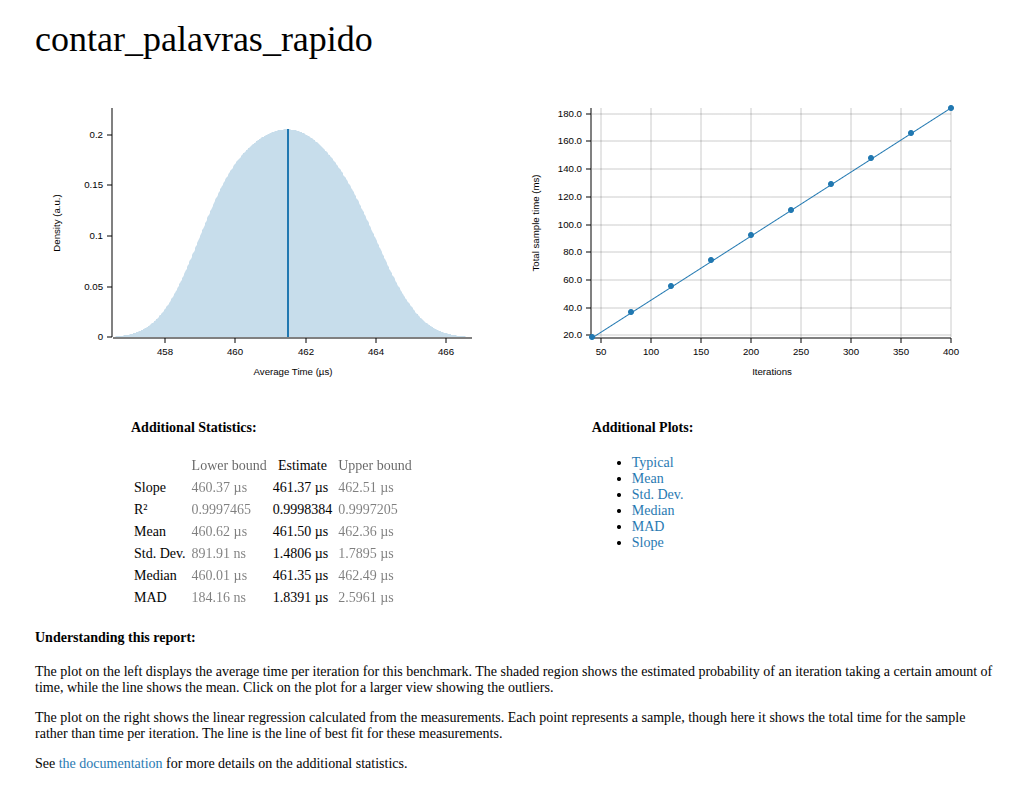
We no longer see wide bars above contar_palavras_rapido. But what exactly does this mean? Let’s look at the Criterion report:
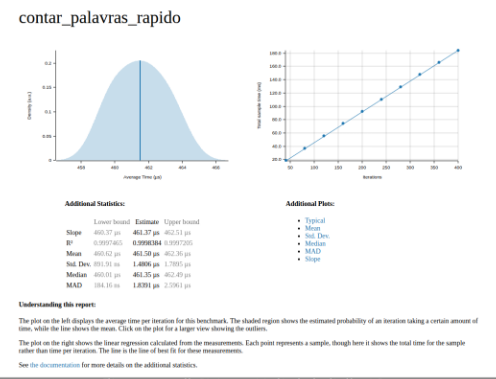
– Average time: dropped to about 451 µs per iteration (less than half a millisecond). Compare with the 182 ms of the slow version: that’s nearly a 400x improvement.
– Distribution: the left graph shows a well-centered, almost symmetric curve. The mean (451.83 µs) and median (451.20 µs) practically coincide, indicating no significant skew.
– Standard deviation: ~1.8 µs, and MAD ~1.5 µs, values tiny relative to the mean. This shows the benchmark is extremely stable, with little variation between runs.
– Right graph: now it’s a linear regression of cumulative times across iterations (Criterion feature). The blue line follows the points without major deviations — another sign of consistency.
Conclusion:
The fast version eliminated the regex recompilation bottleneck. Time dropped from hundreds of milliseconds to microseconds, with well-behaved distribution and very low variability. The hotspot now, as shown in the flamegraph, is just normal regex usage and auxiliary operations (like to_lowercase and map insertion).
Conclusion
When facing a performance issue, after ruling out external “culprits”:
- Operating system scheduler – context switches, CPU contention.
- Noise from other processes – antivirus, browser, background services.
- Power management/turbo – CPU frequency scaling or clock changes.
- Caches and memory – cold caches, swapping, RAM pressure.
- Build environment – compiler flags, lack of optimization, extra symbols.
- I/O interference – disk or network kicking in during tests.
- Virtualization/containers – hypervisor overhead or cgroup limits.
How to identify: repeat tests under controlled conditions, observe variance in Criterion (high standard deviation suggests external noise), use system tools (htop, perf, iostat) to check contention, and compare flamegraphs: if time is lost in system layers and not in your code, the culprit is external.
If the blame lies in your code (wide bars inside and above it), then optimization is the right path. Here’s a concise checklist guided by flamegraph:
- Algorithm and complexity
- Data structures
- Allocations and copies
- Strings and Unicode
- Hot loops
- Cache locality and layout
- Concurrency and synchronization
- I/O and boundaries
- Specialization and CPU
- Quick profile wins