rustingcrab
![]()
jaeger-http-demo
Distributed tracing demo in Rust using OpenTelemetry, OTLP/HTTP, and Jaeger.
This project implements a minimal yet realistic distributed tracing example. A request begins in a simulated “frontend”, then calls a simulated “ads-service” while keeping the same trace and span context. This makes it possible to visualize the entire call chain inside Jaeger.
What this demonstrates
This example covers the fundamental components of the OpenTelemetry ecosystem:
1. Manual instrumentation
We manually create spans using tracing + tracing-opentelemetry, allowing us to record events, attributes, and parent-child relationships.
2. OTLP exporting (OpenTelemetry Protocol)
We use OTLP in HTTP mode to send traces directly into Jaeger without the OpenTelemetry collector.
Endpoint used:
http://localhost:4318/v1/traces
3. Context propagation between services
This example demonstrates real distributed tracing by propagating context between separate “services”.
4. Visualization in Jaeger
All span structure, attributes, and hierarchy can be inspected visually.
Architecture
frontend (root span)
     │
     ▼
ads-service (child span)
Each component creates its own spans, but they all belong to the same trace.
How to run it
1. Start Jaeger (with OTLP enabled)
Using only Docker (no docker-compose):
docker run \
  -e COLLECTOR_OTLP_ENABLED=true \
  -p 16686:16686 \
  -p 4317:4317 \
  -p 4318:4318 \
  jaegertracing/all-in-one:latest
Then open:
http://localhost:16686
2. Run the Rust program
cargo run
You should see logs such as:
frontend: received request
ads-service: processing ads data
If Jaeger is running, the spans will appear automatically.
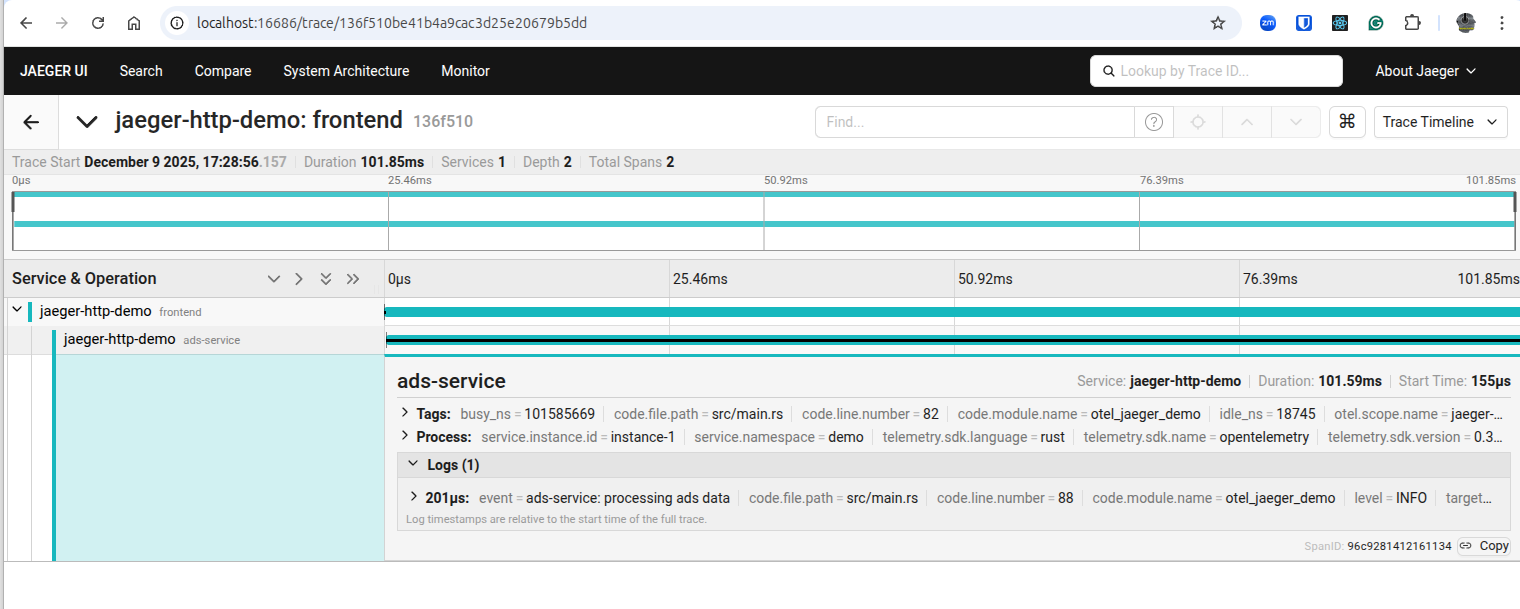
Inspecting the trace in Jaeger
In the UI, search for the service:
jaeger-http-demo
You’ll see:
- the “frontend” span
- the “ads-service” span
- parent-child hierarchy
- attributes
- timing
- timeline
How OTLP works here
OTLP is the native OpenTelemetry protocol.
This example uses the HTTP version, sending spans directly to Jaeger’s /v1/traces.
No Collector in the middle. Jaeger receives and displays traces.
Key code snippets
get the tracer
let tracer = global::tracer("jaeger-http-demo");
create the root span
let root_span = span!(Level::INFO, "frontend", user_id = 42);
inject context
prop.inject_context(&cx, &mut injector);
extract context downstream
prop.extract(&extractor)
This is distributed tracing
Because:
- each service creates its own spans
- context is propagated across services
- Jaeger recognizes the call path
- the full request chain is visible end-to-end